Gantt
The Gantt tool is used to visually plan and track project timelines. It shows when each task starts, when it ends, and how much of it is completed. It can also display connections (dependency relationships) between tasks.
Appearance in Tool Panel Appearance in Free Form
Appearance in Responsive Form
Compatibility
| Free Form | Responsive Form | Mobile |
Features of the Gantt Tool
Type: Shows the field type of the form tool added. This value cannot be modified.
Name: A name is assigned to the form tool. In actions to be used within the form, this name will be used as the field name of the Gantt tool (e.g., Gantt_1).
Edit Form: Specifies the form from which the data to be used in the Gantt chart will be retrieved. This form acts as the source of project-related information.
All forms defined in the current module (such as project forms) will be listed here. Forms can be opened by clicking the small triangle icon, and the relevant form can be selected.
Completion – Heading – Start – Finish:All fields written under this section must be matched with fields from the Edit Form.
The values selected correspond to fields in the Edit Form and should be mapped accordingly.
| If no query is written in the Data Query section related to the table of the Edit Form, the fields under “Completion – Heading – Start – Finish” will not be listed. You must first select the Edit Form, then enter a query in the Data Query, and then fill these four fields. |
Completion: This field is used to indicate what percentage of the task is completed on the Gantt chart.
| When entering values through the Edit Form, the completion value must not be entered as a percentage, but in decimal format. |
Examples:
To display 5%, enter 0.05
For 50%, enter 0.5
For 100%, enter 1
This ensures the Gantt tool correctly calculates and displays completion progress in the bar chart.
Heading: Used as the title (description) field in the selected form. Typically, the column containing project or task names is selected.
This field will be displayed under the Description column in the Gantt chart.
Rows and hierarchical structure (subtasks) are listed based on the values in this field.
Therefore, it is recommended to select a field containing descriptive information such as project name or task name.
Start: Selects the field where the start date is stored.
Finish: Selects the field where the end date is stored.
Main Task: This field is used to show the relationship between projects based on your query (database table).
It holds an ID value that indicates how projects are linked to each other.
If your table has a ParentID field representing project hierarchy, that field should be selected as the Main Task.
Example:
Parent (main) tasks have ParentID = 0 → They are not linked to any other project.
Child tasks contain the UserTableID value of the parent task in their ParentID field.
This creates a hierarchical structure.
In a Gantt chart, this structure helps display relationships between tasks.
Connection Form: This field specifies the form where task connections (dependencies) are stored.
When the user draws a connection (arrow) between tasks on the client side, the related records will be saved into this form.
Resource ID: The field representing the source task in the connection form. It stores the ID of the task from which the arrow originates.
Target ID: The field representing the target task in the connection form. It stores the ID of the task toward which the arrow is drawn.
Time Interval: Defines the time scale interval in minutes for the Gantt chart. For example, tasks can be displayed in increments of 15, 30, or 60 minutes. This adjusts the level of detail shown on the timeline.
Help Text: Displays explanatory text when hovering the mouse over the form tool.
Height / Width: Adjusts the height and width of the form tool.
From Left–Top: Adjusts the distance of the form tool from the left and top edges.
| Note: Width and From Left–Top fields have been removed from Responsive Forms. |
Connection Query (SQL Server): Used when tasks have dependencies. The query brings relational data showing how tasks are connected. If you are not using connections, this field can be left empty—Gantt will still work but without arrows. If relational data is stored in a separate structure, this query must be used.
However, if all data is shown in a single query, the Data Query is sufficient.
Data Query: Defines the SQL query that determines which tasks will be displayed on the Gantt chart.
This query determines:
How tasks are ordered
What date ranges are displayed
Which tasks are dependent
The hierarchical structure
Important: The query must include ParentID. Without ParentID, the Gantt chart will display a flat list without hierarchy.
ParentID rules:
Main tasks must have ParentID = 0
Child tasks must contain the UserTableID of their parent task
| Importance of Using CONVERT in the Data Query |
Some Gantt components require UserTableID and ParentID to be of type INT.
If these fields are NVARCHAR, VARCHAR, UNIQUEIDENTIFIER, etc., the Gantt chart may fail or not display connections.
Therefore, conversion may be required:
CONVERT(INT, UserTableID) AS UserTableID,
CONVERT(INT, ParentID) AS ParentID
Fit Horizontal: Fits the form tool to the full width of the screen.
Display: If set to “No,” the form tool becomes invisible on the screen.
Gantt Example
Let’s create a scenario in which we track projects using the Gantt tool.
You will be able to:
See linked projects
Track their start/end dates
View completion percentages
Edit them easily from the client side
To use the Gantt tool, we need two forms.
1. Create a Projects Form
Add fields such as:
Project Name
Start Date
End Date
Completion Rate
ParentID
Enter some sample records on the client side.
Query to view inserted records:
SELECT
    Projects.UserTableID,
    Projects.ProjectName,
    Projects.StartDate,
    Projects.EndDate,
    Projects.CompletionRate,
    Projects.ParentID
FROM
    dbo.Projects WITH (NOLOCK)
2. Create a ProjectConnections Form
Add fields:
SourceID
TargetID
This form will be assigned to the Gantt tool’s Connection Form field.
Resource ID and Target ID fields in the Gantt tool will map to SourceID and TargetID.
3. Create a Report-Type Form and Add a Gantt Element
In the Gantt tool’s properties, enter the following Data Query:
SELECT
    CONVERT(INT, UserTableID) AS UserTableID,
    Projects.ProjectName,
    Projects.StartDate,
    Projects.EndDate,
    Projects.CompletionRate,
    CONVERT(INT, ParentID) AS ParentID
FROM
    dbo.Projects WITH (NOLOCK)
Then fill the Gantt settings:
Heading → ProjectName
Start → StartDate
Finish → EndDate
Completion → CompletionRate
Main Task / Parent → ParentID
If using connections, assign the Connection Form and define ResourceID & TargetID
After setup, you can view the Gantt chart with start/end dates, dependencies, and completion percentages—and edit data directly on the chart.
Gantt Tool on Xpoda Client
Displays tasks and subtasks with their date ranges on table and timeline
Supports Day/Week/Month/Year views
Colors tasks based on completion
Shows both numeric and graphical completion values
Allows drag-and-drop editing, creating subtasks, and resizing tasks
Updating Completion Percentage – Drag & Drop
Dragging the filled area of a task bar changes the completion percentage.
Effects:
Instant Visual Update: The bar updates immediately.
Database Update: Completion value in the related field is automatically updated—no SQL needed.
Updating Task Duration – Drag & Drop
Dragging the task bar changes its start and/or end dates.
Effects:
Instant Visual Update
Database Update of Start and End date fields automatically
For example, the “Figma design approval” task was originally scheduled for 21.07.2025 – 26.07.2025, but after dragging the task bar to the right, the end date was updated to 28.07.2025.
Deleting Tasks with Subtasks
Tasks can be deleted from the client by clicking the X icon.
When deleting:
Parent and child tasks disappear from the screen
Only the parent task is deleted from the database
Child tasks remain with their ParentID values still assigned → Potential data integrity issue
Users must clean up child records manually if needed.
| When a main task that has child tasks (subtasks) is deleted in the Gantt chart, both the main task and all its associated subtasks are removed from the screen. However, in the database, only the main task record is deleted; the subtask records (child records) remain in the table along with their ParentID values. |
For this reason, when deleting a main task that has child records, caution is required. The subtasks should also be removed on the database side. Otherwise, records with ParentID values that no longer exist may remain in the database, which can negatively affect data integrity.
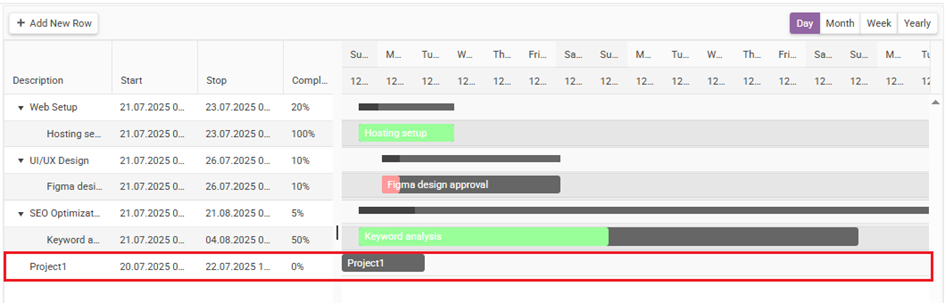
Adding a New Task – Add New Row Button
The “Add New Row” button exists in both upper corners of the Gantt.
Behavior:
1. No task selected → Adds a parent task
A new “New task” row is created and saved.
2. A task is selected → Adds a child task
ParentID is set automatically.
3. When hovering over Add New Row with a subtask selected:
Add New Row: Adds a child task to the selected task
Add After Selected Line: Adds a sibling task (same ParentID)
Editing New Task Name:
Double-click the row → Opens the Edit Form with the selected task data mapped
Change the name → Save → Returns to Gantt with updated display
 Task Connections (Dependencies)
Used to define dependency structures between tasks.
Creating a Connection:
Drag from the right handle of one task to the left handle of another.
Connection Types:
Typical: Finish-to-Start
Others (SS, FF, SF) also possible.
Database Recording:
When a connection is created, the relation is saved in the connection form fields (SourceID, TargetID).
Deleting a Connection:
Cannot be deleted from client UI.
Must be deleted by:
Removing the record in the connection table grid, or
Deleting it via SQL
After deletion, the connection disappears when the Gantt is refreshed.
 AI Assistant